
正文
Monitoring an IBM JVM with VisualVM
【扫一扫了解最新限行尾号】
复制小程序
Monitoring an IBM JVM with VisualVM
分类: Java 2013-06-09 16:15
250人阅读 评论(0)
收藏
举报
JDK6 update 7 and onward include a tool called VisualVM. VisualVM is a visual tool with monitoring and profiling capabilities for the JVM. With VisualVM you can:
-
Monitor heap usage
-
Monitor CPU usage
-
Monitor Threads
-
Initiate garbage collections
-
Profile CPU and memory
-
And more…
Although VisualVM is distributed with the Oracle JDK, it can also be used to monitor IBM JVM’s. VisualVM is not able to connect to the IBM JVM locally. JMX must be used instead. To enable JMX monitoring on the IBM JVM open the WebSphere administrative console
and:
-
navigate to: Server -> Server Types -> WebSphere application servers ->[SERVER_NAME]
-
Expand
Java and Process Management
and click
Process definition
-
Click
Java Virtual Machine
-
In the
Generic JVM arguments
field append the following properties: -Djavax.management.builder.initial= -Dcom.sun.management.jmxremote -Dcom.sun.management.jmxremote.authenticate=false -Dcom.sun.management.jmxremote.ssl=false -Dcom.sun.management.jmxremote.port=1099
-
Restart the server
To start monitoring the JVM with VisualVM start VisualVM by navigating to [JDK_HOME]\bin and start jvisualvm.exe (please note that when VisualVM is downloaded as a separate package the executable is called visualvm.exe instead). In VisualVM click
File
->
Add
JMX Connection
. Specify
localhost:1099
in the connection field and click OK. If everything went OK, you should see the localhost:1099 connection under the Local node in the tree on the left. Double-click this node to start monitoring.
See the following screenshot for an example:
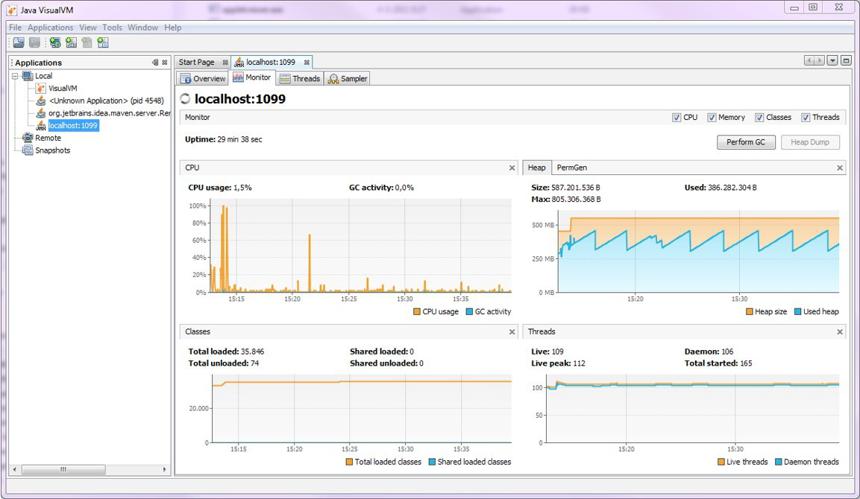
When using a JMX connection to monitor the JVM please be aware that not all functionality can be used compared to monitoring a local JVM. Profiling memory is for example not possible.
The above configuration was tested on:
-
Windows 7 64-bit
-
IBM JDK1.6 64 bit
-
WebSphere Application Server version 7.0
Note: Before JDK6 update 7, VisualVM can also be downloaded separately from http://visualvm.java.net/download.html Note:
To actually test if port 1099 is listening for connections use (on Windows) the
netstat –a
command and check wether the port is present and listening.
250人阅读 评论(0)
收藏
举报
JDK6 update 7 and onward include a tool called VisualVM. VisualVM is a visual tool with monitoring and profiling capabilities for the JVM. With VisualVM you can:
- Monitor heap usage
- Monitor CPU usage
- Monitor Threads
- Initiate garbage collections
- Profile CPU and memory
- And more…
Although VisualVM is distributed with the Oracle JDK, it can also be used to monitor IBM JVM’s. VisualVM is not able to connect to the IBM JVM locally. JMX must be used instead. To enable JMX monitoring on the IBM JVM open the WebSphere administrative console
and:
- navigate to: Server -> Server Types -> WebSphere application servers ->[SERVER_NAME]
- Expand Java and Process Management and click Process definition
- Click Java Virtual Machine
- In the Generic JVM arguments field append the following properties: -Djavax.management.builder.initial= -Dcom.sun.management.jmxremote -Dcom.sun.management.jmxremote.authenticate=false -Dcom.sun.management.jmxremote.ssl=false -Dcom.sun.management.jmxremote.port=1099
- Restart the server
To start monitoring the JVM with VisualVM start VisualVM by navigating to [JDK_HOME]\bin and start jvisualvm.exe (please note that when VisualVM is downloaded as a separate package the executable is called visualvm.exe instead). In VisualVM click
File
->
Add
JMX Connection
. Specify
localhost:1099
in the connection field and click OK. If everything went OK, you should see the localhost:1099 connection under the Local node in the tree on the left. Double-click this node to start monitoring.
See the following screenshot for an example:
When using a JMX connection to monitor the JVM please be aware that not all functionality can be used compared to monitoring a local JVM. Profiling memory is for example not possible.
The above configuration was tested on:
- Windows 7 64-bit
- IBM JDK1.6 64 bit
- WebSphere Application Server version 7.0
Note: Before JDK6 update 7, VisualVM can also be downloaded separately from http://visualvm.java.net/download.html Note:
To actually test if port 1099 is listening for connections use (on Windows) the
netstat –a
command and check wether the port is present and listening.


